About 86 minutes
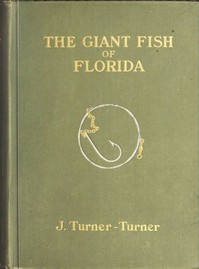
The Giant Fish of Florida — A Reader’s Guide
Marine Life
19,677 recorded words. 30 minutes difference from this book's estimate.
View Gutenberg source #61973

Before opening Fish Populations, Following a Drought, in the Neosho and Marais des Cygnes Rivers of Kansas — A Reader’s Guide, the edition data offers a quick orientation: 26,473 words, 1 hr 56 min estimated reading time, and 5 detected text sections.
The text analysis averages about 14.0 words per sentence, while the detected sections provide another way to judge how the source is divided.
Project Gutenberg metadata also associates the work with “Fish populations,” connecting these edition facts with the source record’s subject description.
Explore this collection
These alternatives are selected using recorded categories and estimated reading time.
About 86 minutes
Marine Life
19,677 recorded words. 30 minutes difference from this book's estimate.
View Gutenberg source #61973About 59 minutes
Marine Life
13,509 recorded words. 57 minutes difference from this book's estimate.
View Gutenberg source #37101About 59 minutes
Marine Life
13,555 recorded words. 57 minutes difference from this book's estimate.
View Gutenberg source #72582Search stored excerpts and compare books → Choose by your preferences →
Choices use stored catalog measurements. Estimates vary with reading speed. A shared category is a catalog label, not a claim that two books have the same argument or literary quality.
Search reads excerpt text stored with this catalog and links to its associated Gutenberg record. The connection is stored in the site database; this tool does not recheck that every excerpt is word-for-word identical to that external record. Excerpt search does not cover every chapter and does not verify historical publication dates.
Catalog snapshot checked: 2026-09-26. Coverage: 99 public books, 99 available source excerpts.
Calculated from edition completeness, EPUB availability, text structure and catalogue metadata. Not a user rating.
Total of 100 points, scaled to a 2.5-5.0 range. Editions with an empty description or a missing EPUB file are not scored.
Public-domain source text
The source text is kept in the dedicated reader, separate from this catalogue record and its commentary.
James E. Deacon's 1961 monograph presents a systematic survey of fish populations in the Neosho and Marais des Cygnes Rivers of Kansas after a drought period. The work is structured as a scientific report, with separate sections for each river's description, methods, annotated species list, and comparative analysis. Deacon employs multiple capture techniques—electrical fishing gear, seines, gill nets, sodium cyanide, rotenone, and dyes—to assess abundance and distribution. The text is dense with tables and figures, including length-frequency distributions and catch-per-unit-effort data across different times of day and years.
The monograph follows a conventional scientific format: introduction, site descriptions, methods, results, and conclusions. However, Deacon subdivides the results into an annotated list of species and separate analyses for the upper Neosho River and a comparison of the two rivers. This dual structure allows him to present both detailed species accounts and broader population trends. The inclusion of multiple tables—such as stream-flow data (Tables 1–4) and length-frequency distributions (Tables 5–8)—provides a quantitative backbone. The text is interspersed with references to these tables, guiding the reader through the evidence.
Drought is not merely a backdrop but a recurring reference point. Deacon notes stream-flow data from 1954 through 1959, showing reduced flows during dry years. In species accounts, he frequently links population changes to drought conditions. For example, he observes that freshwater drum were dominated by yearlings in 1958 after a drought, and that channel catfish numbers fluctuated with water levels. The drought is invoked as a natural experiment, allowing Deacon to infer how fish communities respond to environmental stress. This focus on drought as a shaping force gives the work a cohesive narrative thread.
Deacon moves between spatial and temporal scales. He compares fish faunas at different stations along each river (upper, middle, lower) and across years (1957–1959). Tables 9 and 10 show catch rates at different times of day and night, revealing diel patterns. He also examines local variability within a single station, noting differences in species composition between areas. This layered approach—from broad river comparisons to fine-scale habitat use—demonstrates how fish populations are distributed across space and time. The movement between scenes is systematic, with each section building on the previous one.
Each species account follows a consistent pattern: common and scientific name, then notes on abundance, size, habitat, and behavior. Deacon frequently mentions specific habitats—quiet water, shallow riffles, rubble bottom, mud-bottom—and time of day. For instance, he notes that freshwater drum yearlings were abundant near shore in shallow, moderately fast water over rubble at night, but rare in the same areas during daylight. Such recurring details create a vivid picture of the fishes' ecology. The accounts also include length-frequency tables, showing size distributions across years, which reveal year-class strength and growth.
Readers should approach this work as a primary source of historical fish population data. The extensive tables and species accounts offer raw material for comparisons with contemporary surveys. Deacon's methods—especially the use of multiple capture techniques—provide a model for field studies. While the text is technical, the underlying story of drought and recovery gives it broader ecological relevance.
I found myself thinking about the old drought study again, those careful tables of fish counts in Kansas rivers—how quietly it documented the world rebuilding itself. There’s a similar patience in Superior fishing — Inside the Classic, though it comes from a different angle. One documents, the other reflects, yet both seem to understand that water holds stories we only partially retrieve.
Capture what you thought, learned, and would like to remember.